
Streamline cost estimates and budgets with collaborative tools and resource assignments.
Real-time schedule viewing, analysis, and status updates without editing.
Monitor progress and performance with integrated EVM metrics and reports.
Risk Register, heat maps, Monte Carlo simulations, and schedule risk analysis.
Manage changes with scenario planning, workflows, and impact assessments.
Dozens of reports. Multiple layouts, charts, graphs, and pivot-style analysis, all built in.
More than software. Expert project controls guidance, grounded in decades of hands-on experience across projects of every size and complexity.
From PMCS implementation to project closeout, we train your team the same way we train our own, to be experts.
Real projects. Real results. What worked, what didn't, and what we learned.
When every dimension of your project lines up, the answer is yes. We help you get there.

Trusted by the World’s Most Complex Projects
We’ve Been Where You’re Going
Access on-demand sessions on project controls, EVM, and best practices for complex projects.
Read insights on Dash360 solutions and project management for big science and technology endeavors.
Tune into expert discussions on building high-performing teams and achieving project success.
Stay informed with the latest announcements and updates from Dash360.
Download detailed guides on cost estimating, risk management, and project lifecycle strategies.
Get to know the experts driving Dash360's innovative project management solutions.
Join talented professionals working on groundbreaking projects
From 1980s project controls pioneers to modern innovators in complex project management.
Reach out for inquiries, support, demos, or partnerships

Meet the Dash360 Team
Streamline cost estimates and budgets with collaborative tools and resource assignments.
Real-time schedule viewing, analysis, and status updates without editing.
Monitor progress and performance with integrated EVM metrics and reports.
Risk Register, heat maps, Monte Carlo simulations, and schedule risk analysis.
Manage changes with scenario planning, workflows, and impact assessments.
Dozens of reports. Multiple layouts, charts, graphs, and pivot-style analysis, all built in.
More than software. Expert project controls guidance, grounded in decades of hands-on experience across projects of every size and complexity.
From PMCS implementation to project closeout, we train your team the same way we train our own, to be experts.
Real projects. Real results. What worked, what didn't, and what we learned.
When every dimension of your project lines up, the answer is yes. We help you get there.
Trusted by the World’s Most Complex Projects
We’ve Been Where You’re Going
Access on-demand sessions on project controls, EVM, and best practices for complex projects.
Read insights on Dash360 solutions and project management for big science and technology endeavors.
Tune into expert discussions on building high-performing teams and achieving project success.
Stay informed with the latest announcements and updates from Dash360.
Download detailed guides on cost estimating, risk management, and project lifecycle strategies.
Get to know the experts driving Dash360's innovative project management solutions.
Join talented professionals working on groundbreaking projects
From 1980s project controls pioneers to modern innovators in complex project management.
Reach out for inquiries, support, demos, or partnerships
Meet the Dash360 Team
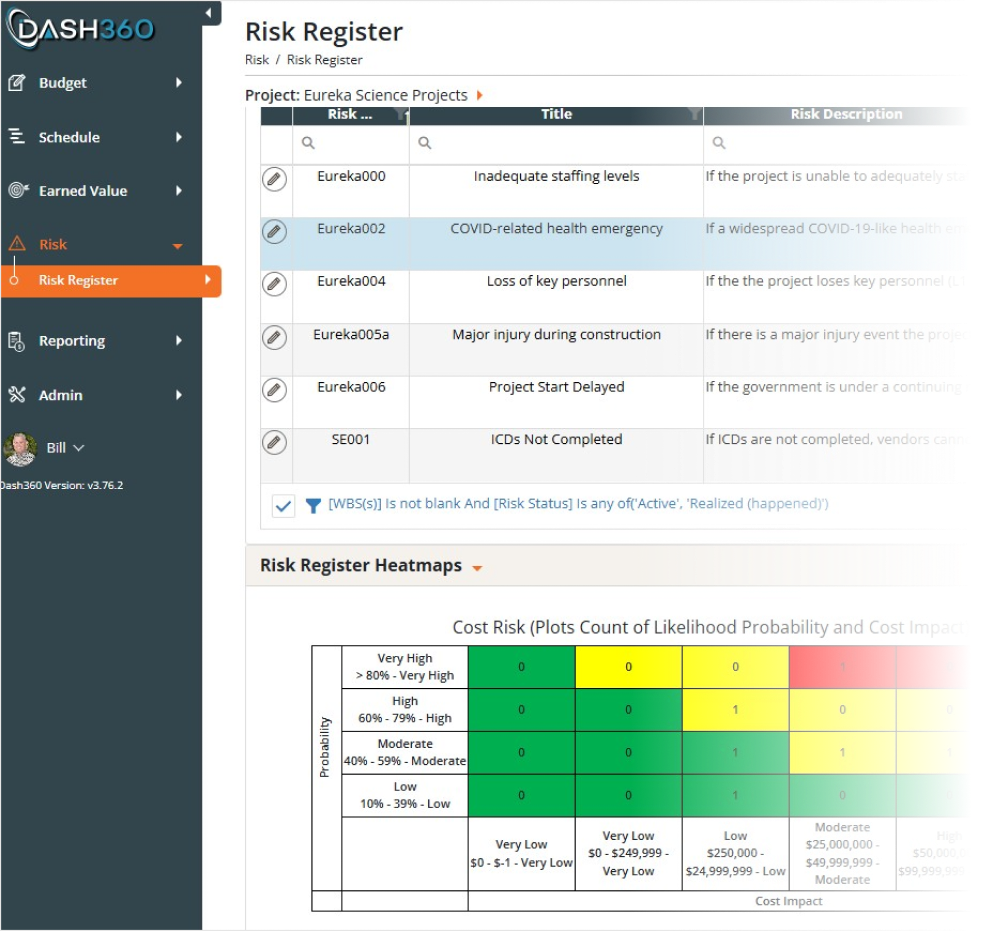
Dash360 Risk manages project risk in the same platform as your estimate, budget, and schedule — no separate risk tool, no re-keying, no reconciling spreadsheets. Every risk you log is tied to your WBS, work packages, and activities, so risk analysis reads from the same numbers your project already runs on.
| Features | Lite | Pro |
| Features | $1,000 /year | $5,000 /year |
| Risk Register (create/edit, threats & opportunities, handling strategies) | ||
| Risk mapped to WBS, work packages & activities | ||
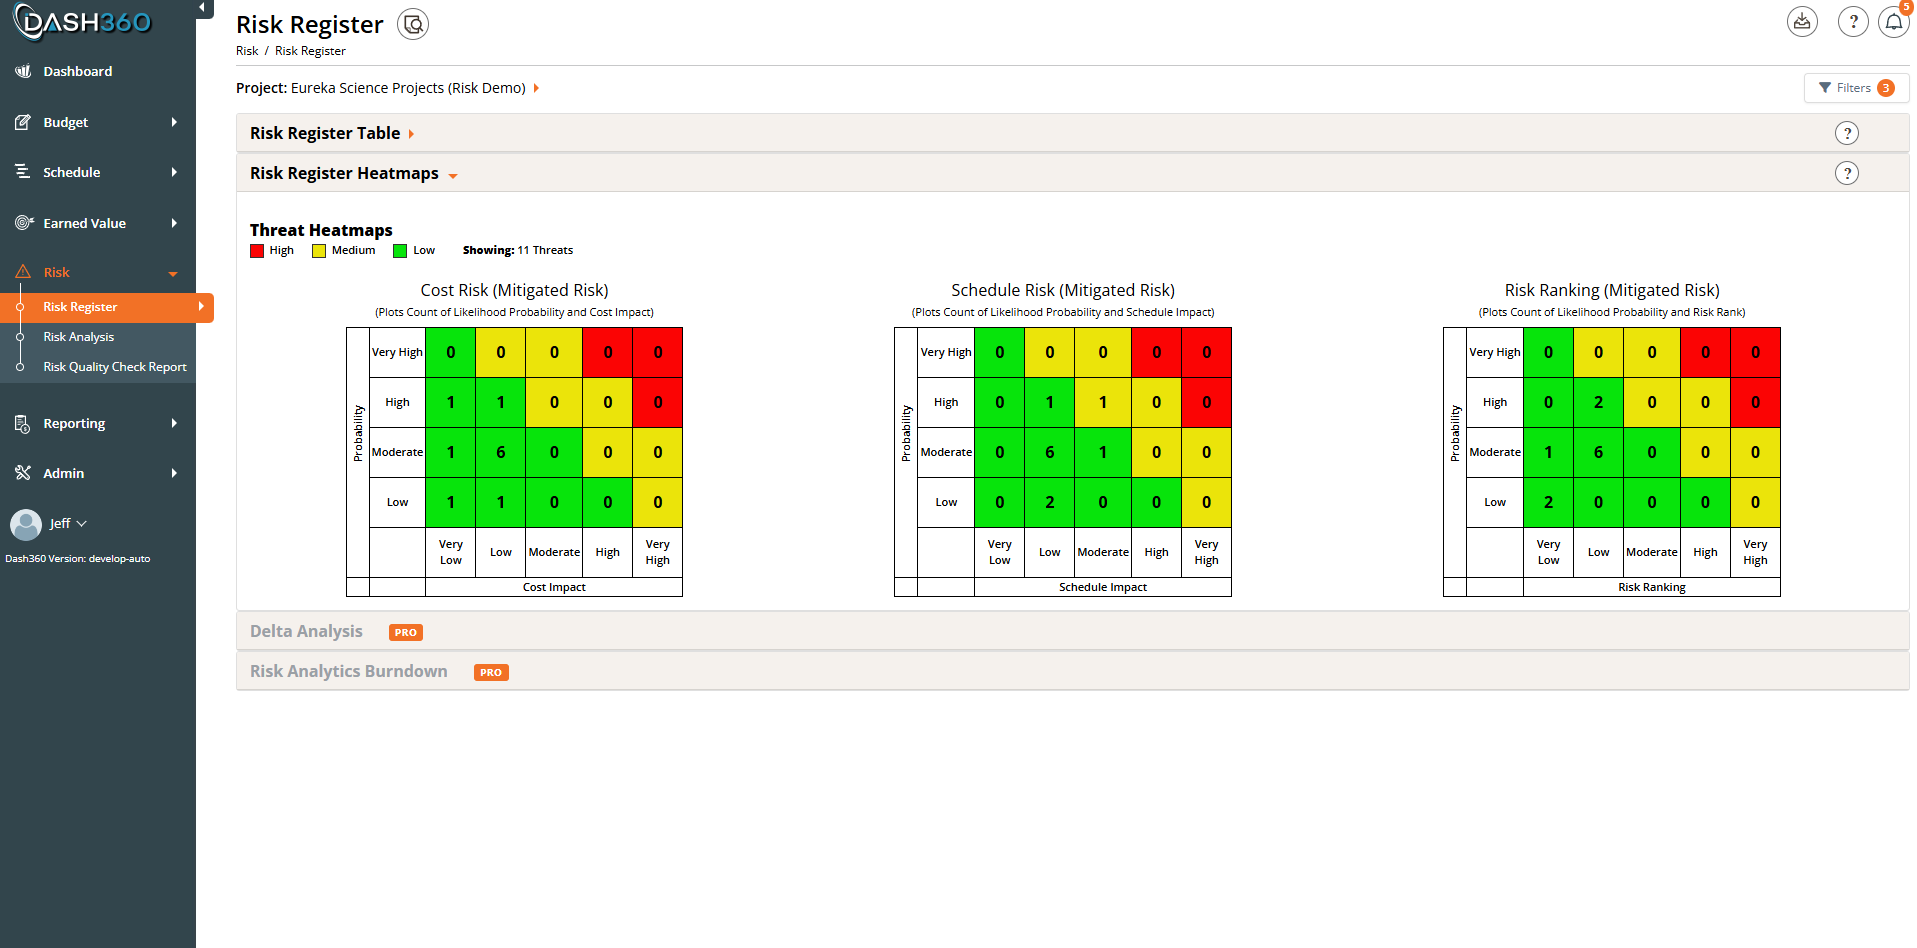
| Probability × Impact heatmaps | ||
| Configurable Risk / Mitigated Risk terminology | ||
| Response Actions (mitigation tracking) | ||
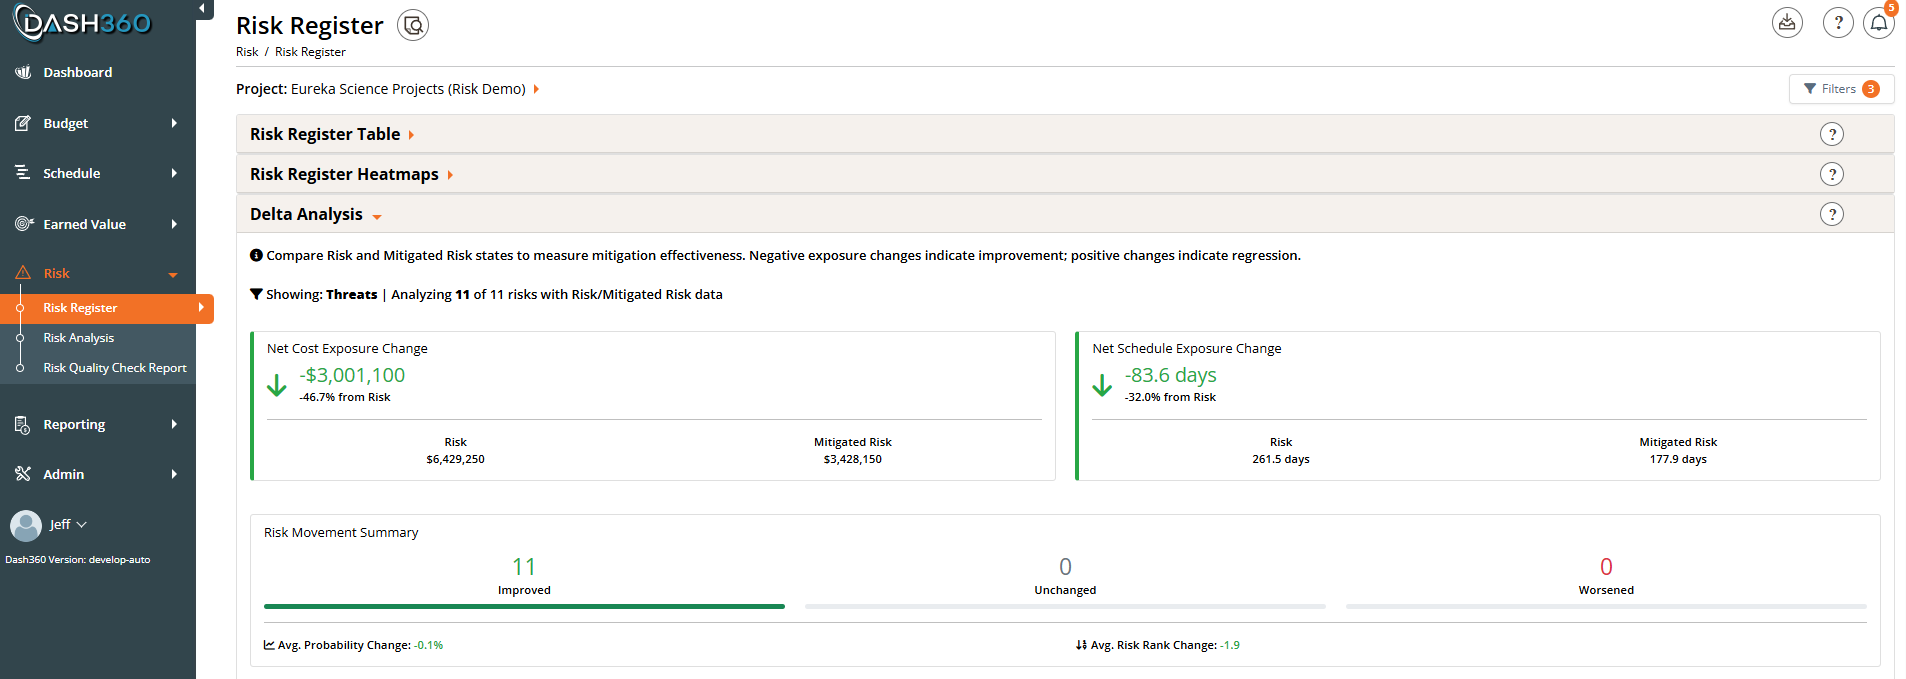
| Total Exposure summary (Risk vs Mitigated, cost & schedule) | ||
| Risk Quality Check Report | ||
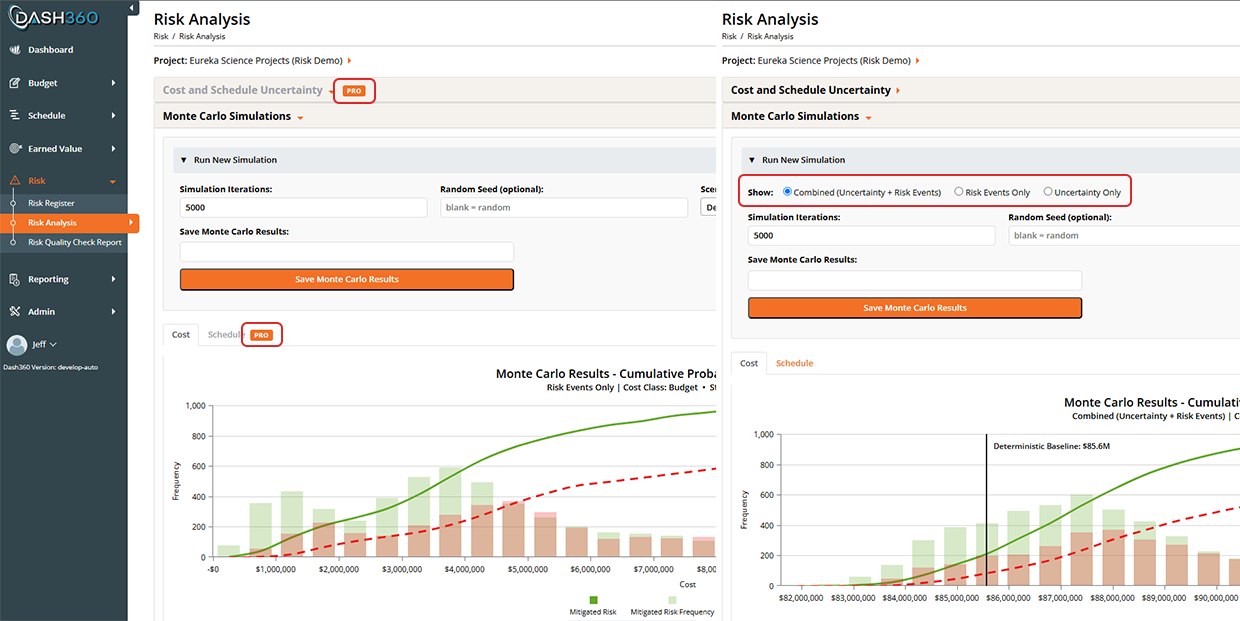
| Cost Monte Carlo — Risk Events Only (S-curve + percentiles) | ||
| Full Monte Carlo modes (baseline + risk uncertainty) | ||
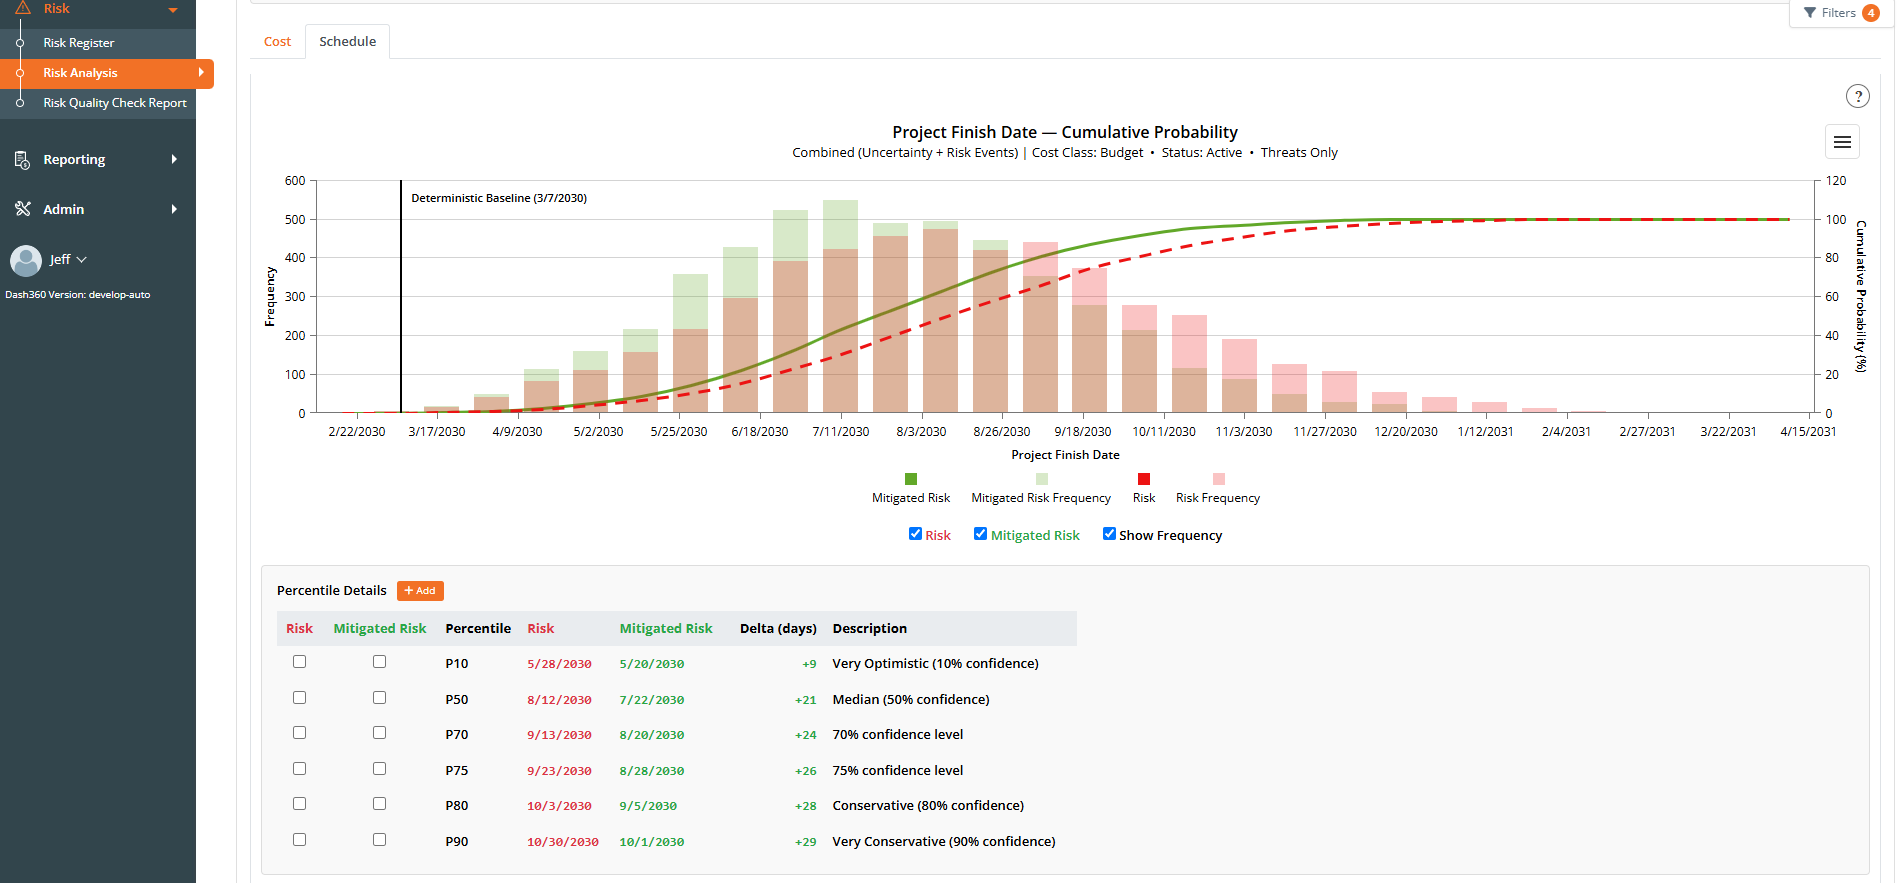
| Schedule Risk Analysis | ||
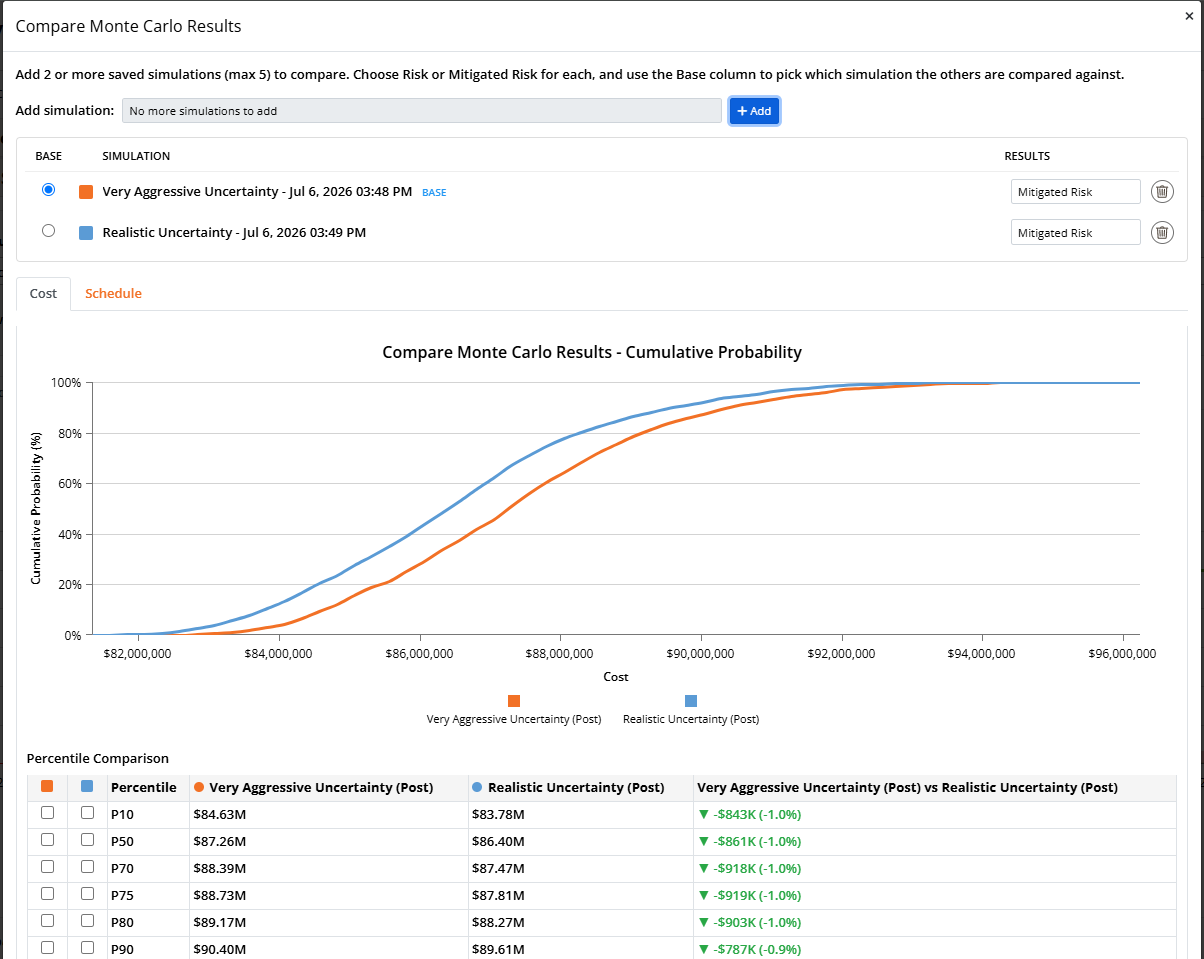
| Compare Monte Carlo Simulations | ||
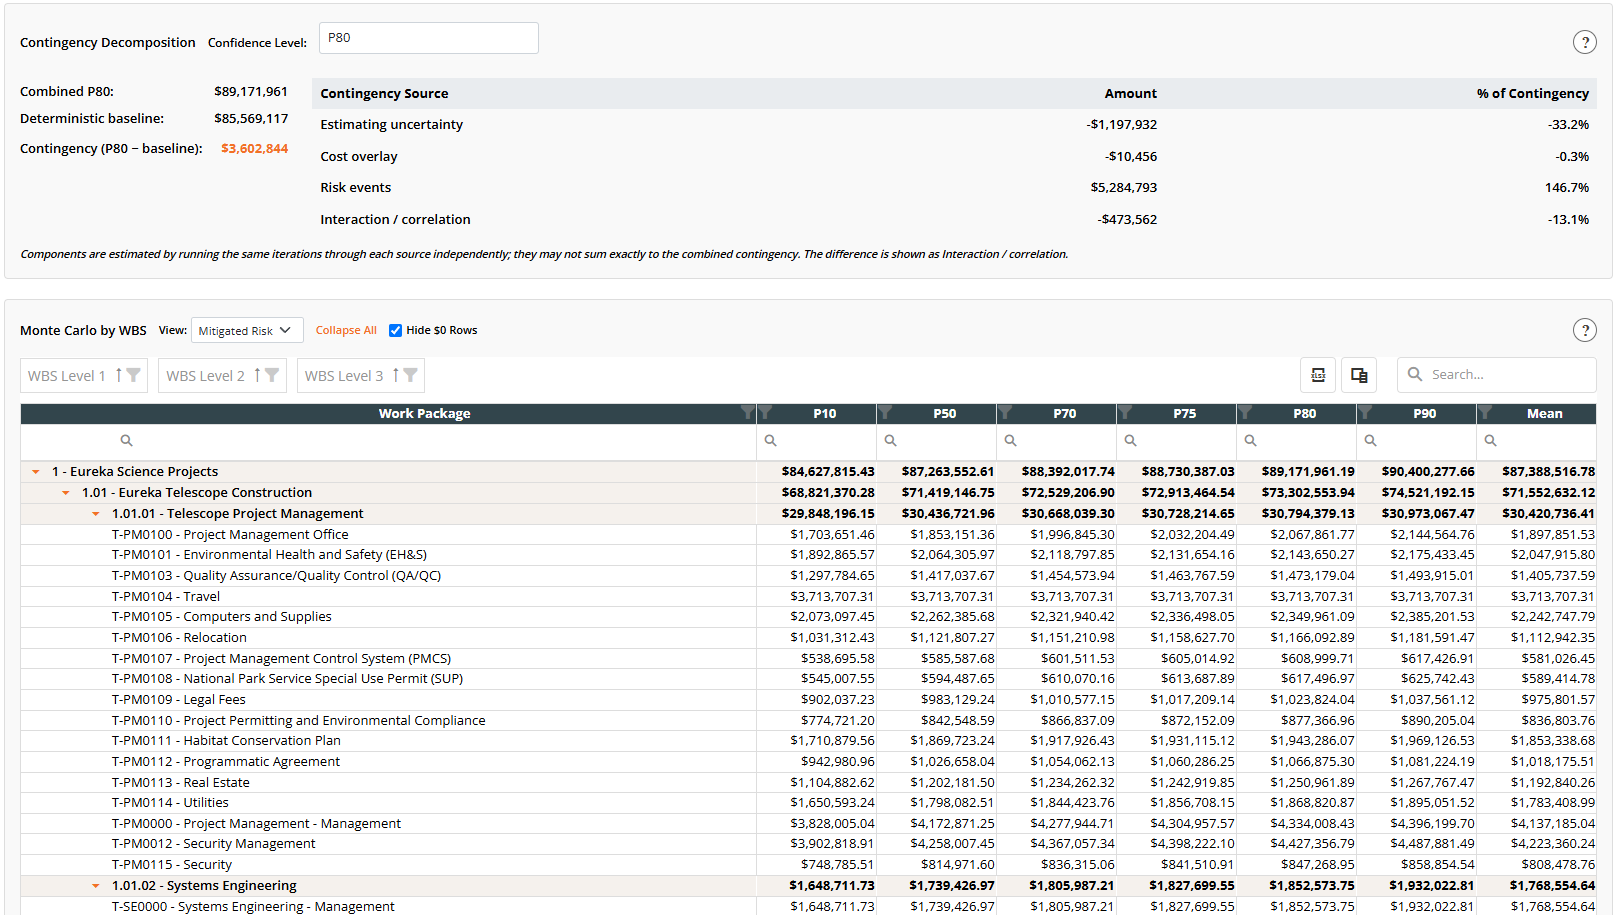
| Cost Monte Carlo by WBS | ||
| Contingency Decomposition | ||
| Cost-Structure Sensitivity | ||
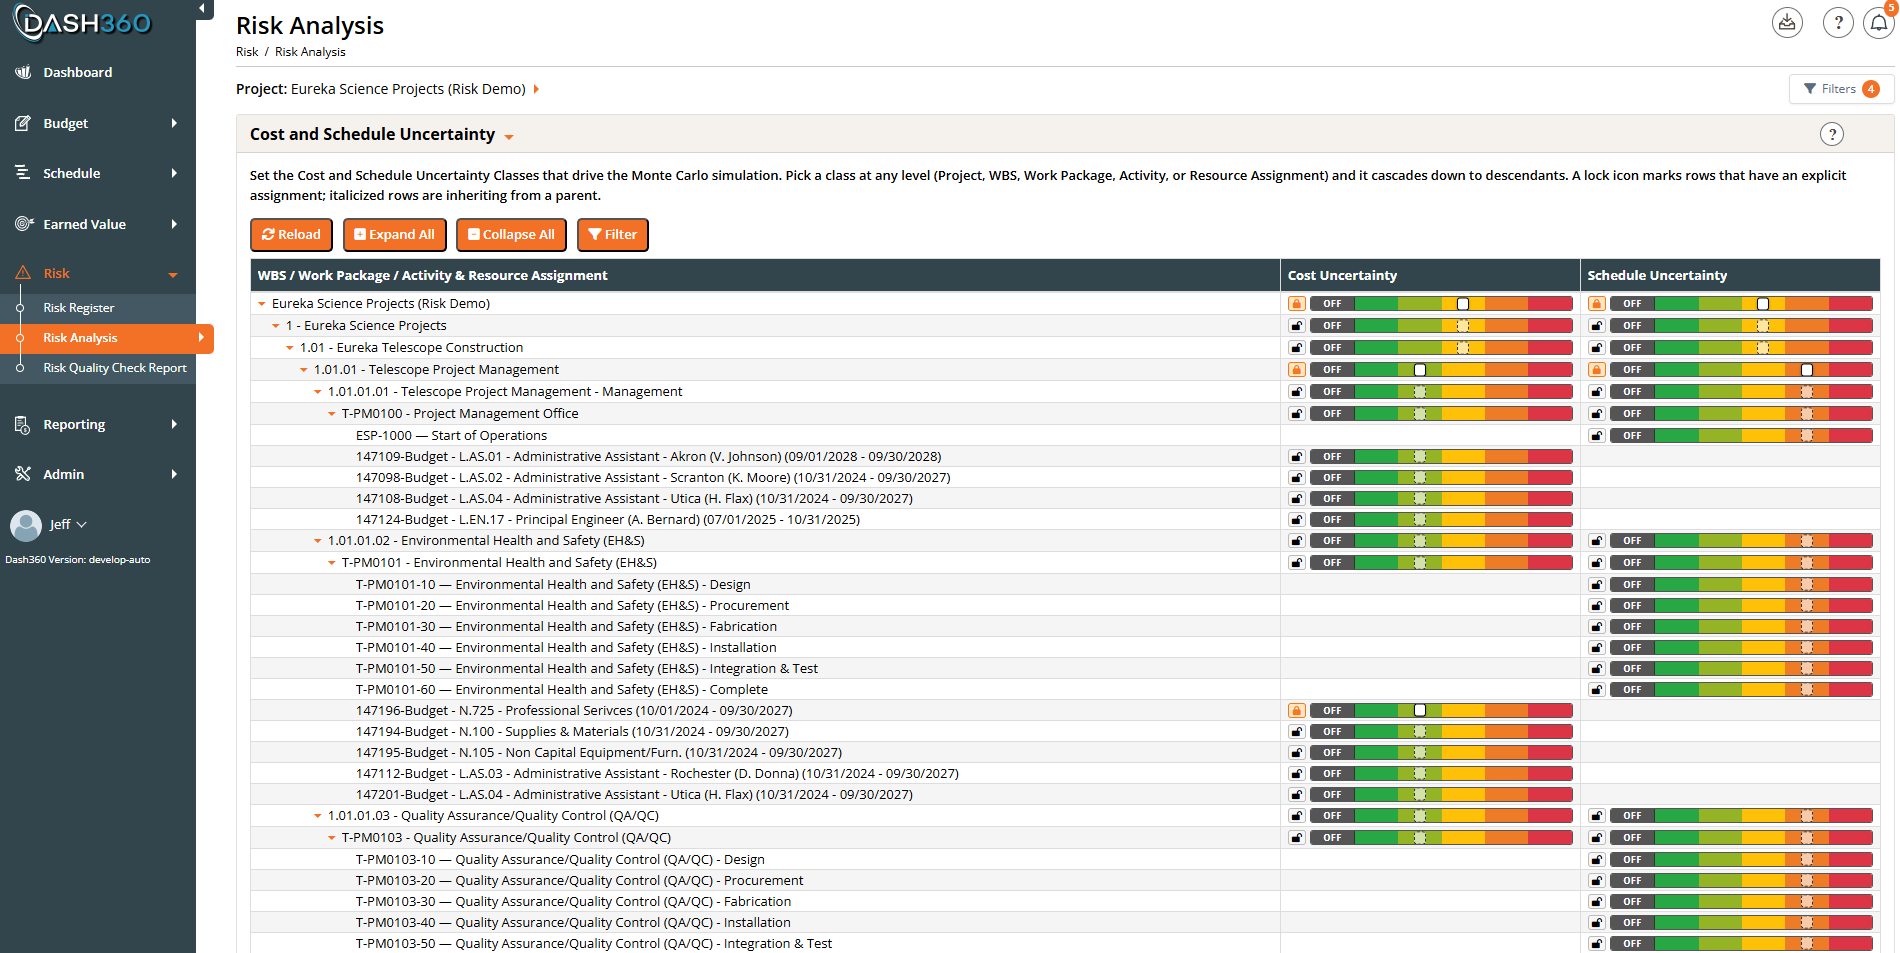
| Cost & Schedule Uncertainty Cascade | ||
| Delta Analysis (Risk → Mitigated movement) | ||
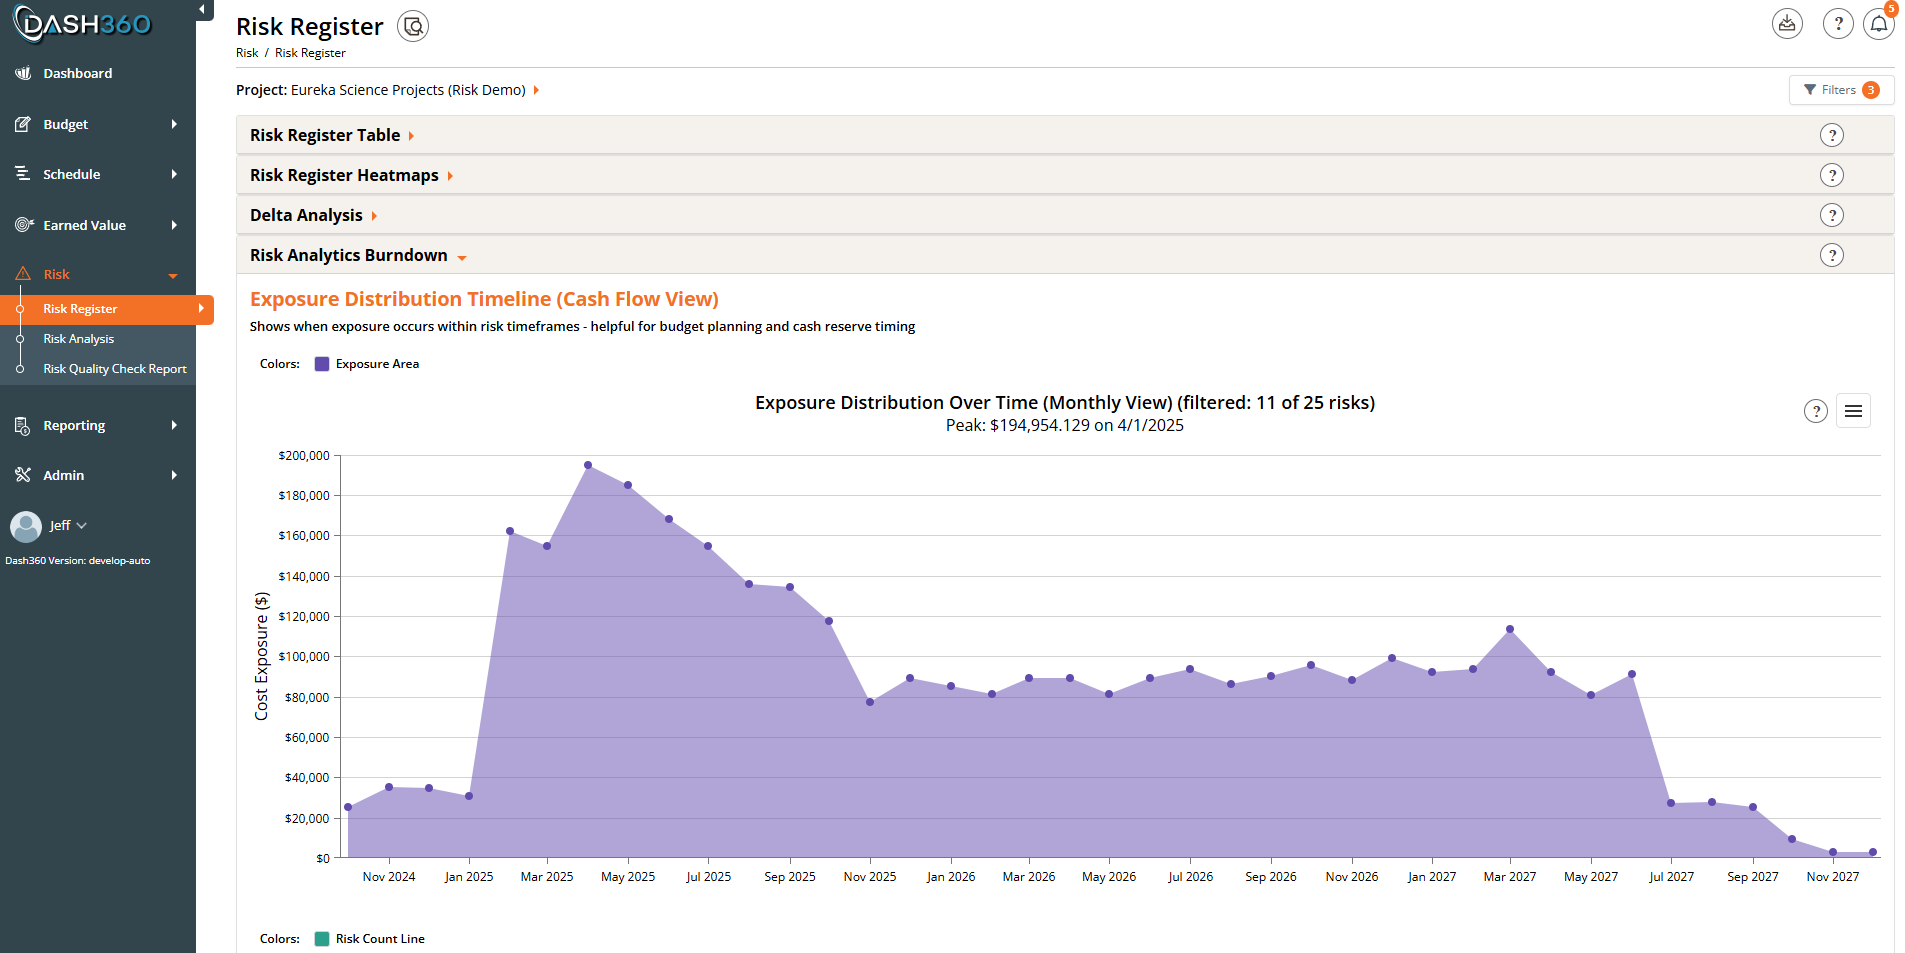
| Risk Analytics Burndown - Built-in Charts / Graphs of Risk Data | Contact Us | Contact Us |
Lite is a complete risk-management workflow on its own.
Pro turns the register into a full quantitative risk analysis environment. Each section below maps to a feature that is grayed out in Lite with an “upgrade” prompt.
Copyright © 2026 Dash360 – All Rights Reserved